
Time Log
- Sunghyun Ahn (2026-03-08, 17:00-17:25)
- Doga Karabey (2026-03-08, 17:27-18:00)
- Fariha Shah (2026-03-08, 18:20-18:40)
- Nicole Nagata (2026-03-08, 18:50-19:10)
1. Summarize your activities, including new content created. Provide all the hyperlinks of new content.
In this assignment, I created two new posts. The first post shows some pictures of my dog Senna. The second post explains and gives an example of proof by contraposition. In addition to the new posts/pages, I also updated the homework directory page and website directory to include links to the new content.
2. Summarize and analyze your automated insight. Include a screenshot.
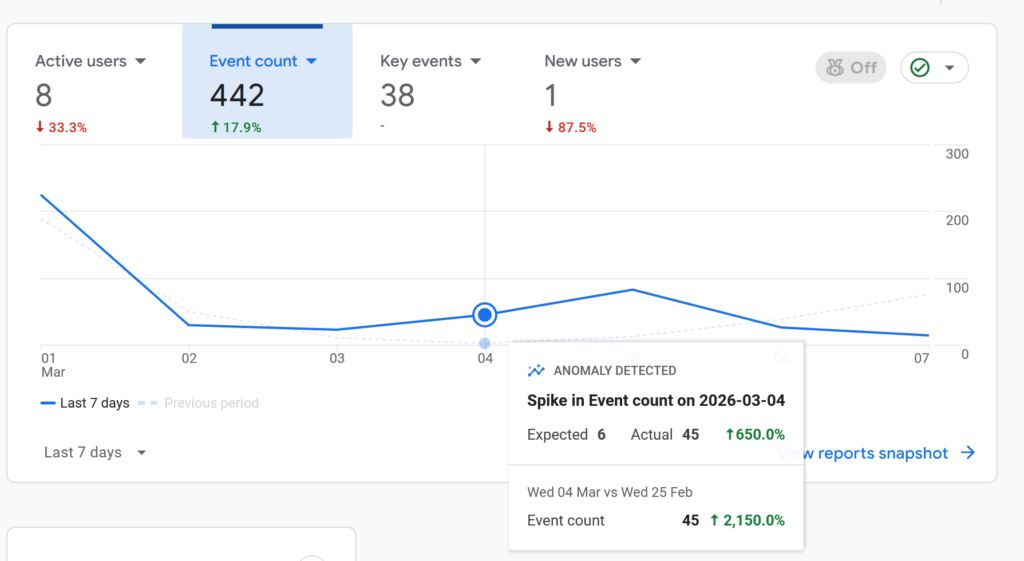
On the home dashboard of Google Analytics, I see a lineplot for the performance indicators active users, event count, key events, and new users. When I click on the event count tab and hover March 4th, I see an automated insight saying that that the number of events is anomalous. In particular, it expected to see 6 events (presumably based on past event count data) but actually saw 45 events. If this was actually for a business, it would be important to try a track down and understand what caused this.
3. Summarize and analyze your custom insight. Include a screenshot.
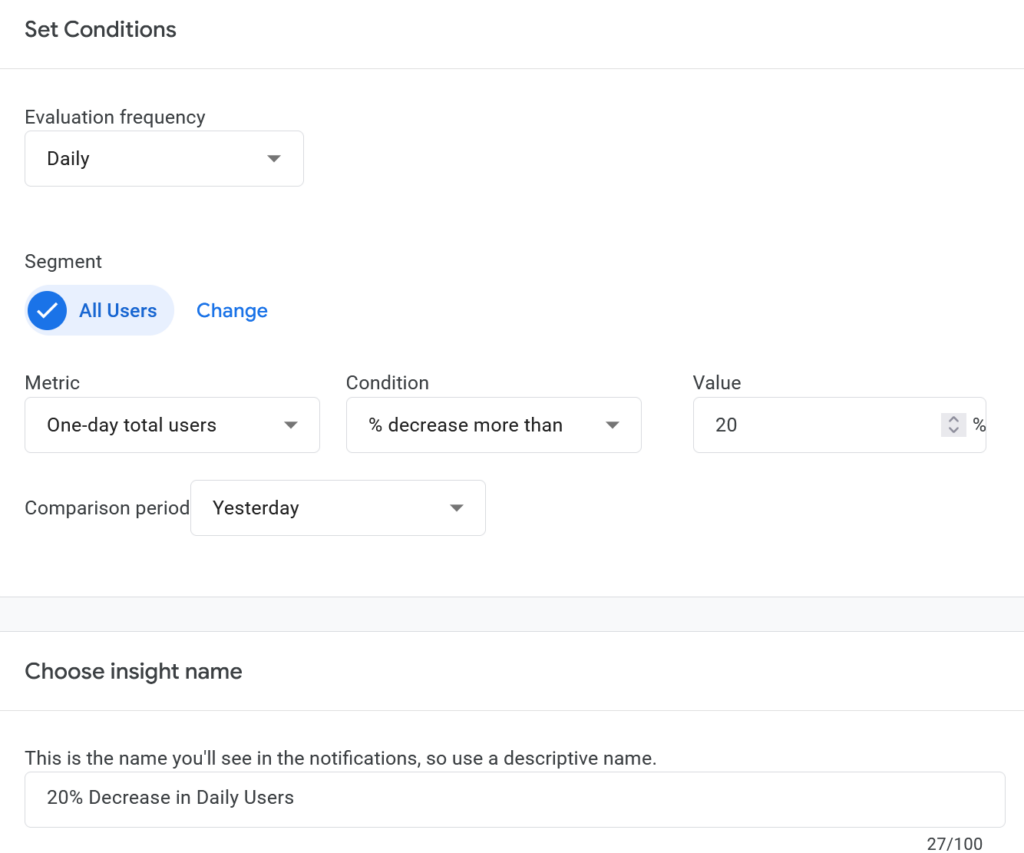
I created a custom insight called “20% Decrease in Daily Users” to send me a notification if the daily users drops by 20% or more from day to day. For a small website with inconsistent traffic this is less about user stability and more about pinging me to investigate potential problems. In particular, my website went down last week and I didn’t realize it until the professor emailed me. With this insight active, I should be notified because the daily users will go to 0.
Leave a Reply